Parametrized postprocessing with RIG-VM
The 3D postprocessing files (*.pos) produced in simulation runs can be
opened and further processed with GMSH; however, the handling of many
files and the performance of post processing operations such as
time-averaging, cut-planes, line profiles etc. can be cumbersome this
way. For that purpose, a RIG-VM module module_ppp.so1) is
provided. This module offers the following:
- Importing binary post-processing (
*.pos) - files generated during DSMC / PIC-MC runs - Further arithmetic processing of imported data
- Perform time averaging
- Creation of user-specified reduced views such as cut-planes, line profiles etc.
- ASCII export of processed data
Prerequisites / installation
The file module_ppp.so is a module of the scripting language RIG-VM
which is part of the PIC-MC software package. Within the installation
directory, the module file is located in the .../lib/* directory, while
the RIG-VM script interpreter is located in .../bin/*. The module comes
with the PIC-MC distribution and should be located under
/.../path/to/picmc/lib. To use it within RIG-VM from command line, make sure that the following environment
variables are set as follows:
- LD_LIBRARY_PATH=$LD_LIBRARY_PATH:/path/to/picmc/lib
- PATH=$PATH:/path/to/picmc/bin
If PIC-MC is installed, it is very likely that the environment variables are already correctly set.
General usage
The postprocessing module is used within RIG-VM scripts (ASCII files,
which typically have the file extension *.r). These scripts should in
general be in the following format:
compiletime load "module_ppp.so";   # Import post processing module
case = BATCH.file;                  # Get filename of respective *.par file
PPP obj = {};                       # Initiate post processing object 'obj'
# do some postprocessing stuff with obj.
# ...
The acronym PPP stands for PIC-MC Postprocessing.
Assumed that the script is named extract.r, its invocation from the command line works via
rvm -b extract.r simulationcase.par
It is also possible to use the same script on multiple *.par files in
batch mode:
rvm -b extract.r *.par
The following sections give a summary of all commands integrated in the postprocessing module as well as a general description of the concept. Afterwards, the functionality of the respective functions is shown in examples.
Summary of commands
In the following all postprocessing commands are summarized:
obj.read("input.pos", "variable_name");
obj.merge("input.pos", "variable_name");
obj.append("input.pos", "variable_name");

obj.xy_plane(z0, delta_z, "method");
obj.xz_plane(y0, delta_y, "method");
obj.yz_plane(x0, delta_x, "method");
obj.plane(x0, y0, z0,   x1, y1, z1,   x2, y2, z2,   delta, N, M, "method");
obj.line(x0, y0, z0,   x1, y1, z1,   delta, N, "method");

obj.cylinder(x0, y0, z0,   x1, y1, z1,  r_cyl,  delta,  nl, nphi, "method");

obj.write_pos_scalar("output.pos", "View title", expression);
obj.write_pos_vector("output.pos", "View title", expression_x, expression_y, expression_z);
obj.write_pos_scalar_binary("output.pos", "View title", expression);
obj.write_pos_vector_binary("output.pos", "View title", expression_x, expression_y, expression_z);
obj.write_pos_triangulate("output.pos", "View title", expression);
obj.write_tec_scalar("output.dat", "View title", expression);
obj.write_tec_vector("output.dat", "View title", expression_x, expression_y, expression_z);
obj.write_vtk_scalar("output.vtp", "View title", expression);
obj.write_vtk_vector("output.vtp", "View title", expression_x, expression_y, expression_z);
obj.write_txt("output.txt", ["col1", "col2", ...], [exp1, exp2, ...]);
obj.write_csv("output.csv", ["col1", "col2", ...], [exp1, exp2, ...]);

obj.write_pos_scalar_parametric("output.pos", "View title", x, y, z, expression);
obj.write_pos_scalar_binary_parametric("output.pos", "View title", x, y, z, expression);
obj.write_pos_vector_parametric("output.pos", "View title", x, y, z, expression_x, expression_y, expression_z);
obj.write_pos_vector_binary_parametric("output.pos", "View title", x, y, z, expression_x, expression_y, expression_z);

obj.write_pos_time_steps_scalar("output.pos", "View title", "variable_name");
obj.write_pos_time_steps_scalar_binary("output.pos", "View title", "variable_name");
obj.write_pos_time_steps_vector("output.pos", "View title", "variable_name");
obj.write_pos_time_steps_vector_binary("output.pos", "View title", "variable_name");

obj.create_scalar("variable_name", expression);
obj.create_vector("variable_name", expression_x, expression_y, expression_z);

result = obj.integrate(expression);
obj.identity();
obj.reduce();
obj.convolution(vx, vy, vz, T, interpolation);
obj.convolution_circular();
Function reference
After having initiated a post processing object obj (any other name is
possible, too) as described in section General usage,
its internal methods can be invoked as member functions.
Functions to import data
There are three main functions for importing data:
obj.read("input.pos", "name");Reads an input file in GMSH postprocessing format*.posand stores it under the internal name name. If multiple files are loaded under the same name, they are automatically internally averaged. This feature is mostly being used for time-averaging over multiple data snapshots taken at different times.obj.merge("input.pos", "name");This command is used for combining multiple postprocessing files with different data coordinates into a single dataset. It is mostly being used for combining multiple files with e.g. individual particle positions taken at different timesteps into a trajectory plot.obj.append("input.pos", "name");The append command is used to append multiple postprocessing files into a time series.
Simple cut planes
A simple functionality, which is most frequently used, is to make a 2D cutplane from a 3D dataset, which is parallel to the coordinate axes. There are the following three options for that:
obj.xy_plane(z0, delta_z, "method");Cutplane parallel to the X-Y axes at z coordinate z0 within a range for data points of z0 ± δzobj.xz_plane(y0, delta_y, "method");Cutplane parallel to the X-Z axes at y coordinate y0 within a range for data points of y0 ± δyobj.yz_plane(x0, delta_x, "method");Cutplane parallel to the Y-Z axes at x coordinate x0 within a range for data points of x0 ± δx
The "method" parameter describes how to project data points onto the
cut plane. There are three options:
"nearest_neighbour"The nearest datapoint located in perpendicular direction within the search range is projected onto the cutplane."average"All data points located in perpendicular direction within the search range are averaged, and the average value is taken at the position of the cutplane."interpolate"The value is calculated by linear interpolation between two data points located on both sides of the cutplane within the search radius
General oblique planes and lineprofiles
Oblique cutplanes can be created with the more general methods
obj.plane(x0, y0, z0,   x1, y1, z1,   x2, y2, z2,   delta, N, M, "method");
obj.line( x0, y0, z0,   x1, y1, z1,   delta, N, "method");
For a detailed description, please refer to this example.
Cylindrical cutplanes
2D cutplanes along a cylindrical surface can be obtained via
obj.cylinder(x0, y0, z0, x1, y1, z1, r_cyl, delta, nl, nphi, "method");
Please refer to the example on cylindrical cutplanes for further explanation.
Output functions
The postprocessing module can create output files either in GMSH
postprocessing format *.pos, Techplot format or VTK format. Depending
on the type of data, the outputs can be either in scalar or vector
format. The available GMSH output commands are listed in the
summary of commands above.
The commands write_pos_scalar and write_pos_vector produce GMSH
*.pos files in ASCII format, which contain either scalar or vector
data. The commands write_pos_scalar_binary and
write_pos_vector_binary do the same but produce files in binary *.pos
format, which is somewhat compressed in comparison to the ASCII format.
The command write_pos_triangulate works only after a 2D cutplane
operation and produces a triangulated view of scalar data, which means
that they are represented as a triangulated surface.
Each command takes the name of the outputfile and the caption of the view
("View title") as arguments, followed by one or more arithmetic
expressions. The expression parameters contain an arithmetic expression,
which should be evaluated at the respective datapoints of the last
operation (cutplane, lineprofile etc.). They could use the variables
x, y, z, which represent the actual coordinates, and in case of
cylindrical cutplanes also the variable phi, which represents the
azimuth angle. Additionally, it can contain any of the variable names
specified under name in the import functions as well as their maximum
and minimum value via name_max and name_min. If the imported
quantity is a vector dataset, the individual components are accessible
via name_x, name_y, name_z, and thereof, the maxima / minima
are again accessible via name_x_max, name_x_min etc.
There is an additional category of output functions
(write_pos_scalar_parametric, write_pos_scalar_binary_parametric,
write_pos_vector_parametric, write_pos_vector_binary_parametric),
where also the coordinates of the output data can be explicitely
manipulated. These functions work in the same way as the functions
described above, but take the coordinates x, y, z as additional
input. The purpose is to transform the coordinates of the output data in
order to e.g. give them a coordinate offset or to project them onto a
cylindrical surface.
Output functions of scalar and vector data in Techplot (write_tec_*)
and VTK (write_vtk_*) format work in the same way; their syntax is
given in the summary of commands and they are described in the section
Additional output formats.
For export of data in ASCII files (either *.txt or *.csv) the
commands write_txt and write_csv are available. Besides the name of
the output file, these functions expect a list of column names and a list
of expressions for the columns (obviously, both lists have to be of the
same length). The expressions in the expression list can use the same
variable names as described above.
Finally, there are output functions for time series (animations), the
write_pos_time_steps_* commands. In contrast to the previous output
functions, they work not (yet) with arithmetic expressions but only with
variable names, as were used in the "name" argument of the append
command. If needed, additional input data sets can be computed via the
commands create_scalar, create_vector as described in the
data manipulation section.
Usage of the module by examples
The module is to be used within RIG-VM scripts. We demonstrate the postprocessing capabilities on the DSMC gas flow example from this tutorial.
Simple scalar cut-plane
One of the easiest and most frequent tasks is to create a quick cut-plane aligned parallel to XY, XZ or YZ plane. Assumed, we have the file pressure_Ar_60.00ms.pos from a DSMC run of the tube example as output file, and would like to have a scalar pressure plot in the XY plane. The according script - let's call it extract.r looks like follows:
compiletime load "module_ppp.so";
PPP obj = {};

obj.read("pressure_Ar_60.00ms.pos", "pAr");
obj.xy_plane(0, 10, "nearest_neighbour");
obj.write_pos_scalar("cutplane_xy.pos", "Ar pressure [Pa]", pAr);
The script can be executed with rvm as shown in the following console output.
ap@sim037:~/sim/Tube/sample$ rvm extract.r
Created View {pAr}
File pressure_Ar_60.00ms.pos has 109368 scalar and 0 vector points
XY-Plane extract, z0 = 0 +/- 10, method = 'nearest_neighbour'
ap@sim037:~/sim/Tube/sample$
As result, the output file cutplane_xy.pos is created and can be viewed in GMSH.
The meaning of the commands in the last three lines is as follows:
obj.read("input.pos", "variable_name");- The first parameter is the filename of the binary POS file
- The second parameter is a variable name used for referencing these data in a later step
obj.xy_plane(z0, delta_z, "method");z0is the center coordinate of the XY planedelta_zis the range, where data points will be consideredmethodis the interpolation method with following options:"nearest_neighbour": Within the given range delta_z, the points which are closest to z0 are projected onto the cut plane"average": Within the given range z0 +/- delta_z, all points belonging to the same (X,Y) coordinate are projected onto the cut-plane and averaged."interpolate": Points from the given range z0 +/- delta_z are interpolated on the cut-plane. The interpolation weighting function is 1.0 at z==z0 and decreases linearly to 0.0 for z-->z0 +/l delta_z."sum": Values from the given coordinate range z0 +/- delta_z are summed up.
obj.write_pos_scalar("output.pos", "plot_title", expression);- This writes a scalar output file named
"output.pos". - The
"plot_title"will be shown as view title in GMSH. - With
expressionthe scalar output value can be specified. In the above example, it is just the pressure value namedpAr.
- This writes a scalar output file named
Besides of obj.xy_plane(z0, delta_z, "method") there are also
obj.xz_plane(y0, delta_y, "method"); and
obj.yz_plane(x0, delta_x, "method"); available.
Scalar cut-plane with arithmetics
Within the expression parameter it is possible to do some arithmetics.
If e.g. the pressure should be plotted in mTorr instead of Pa (1 mTorr =
133 mPa), the following script will do it:
compiletime load "module_ppp.so";
PPP obj = {};

obj.read("pressure_Ar_60.00ms.pos", "pAr");
obj.xy_plane(0, 10, "nearest_neighbour");
obj.write_pos_scalar("cutplane_xy.pos", "Ar pressure [mTorr]", pAr*1000/133);
Scalar cut-plane with triangulation
By replacing the command write_pos_scalar by write_pos_triangulate
it is possible to create a triangulated scalar view:
compiletime load "module_ppp.so";
PPP obj = {};

obj.read("pressure_Ar_60.00ms.pos", "pAr");
obj.xy_plane(0, 10, "nearest_neighbour");
obj.write_pos_triangulate("cutplane_xy.pos", "Ar pressure [mTorr]", pAr*1000/133);
Scalar cut-plane from multiple input files
Let's assume we would like to plot the flux (=density*velocity) in positive X direction but have forgotten to activate the density plot in the parameter file. Instead we have only the number and the velocity plots available.
The postprocessing module allows us to plot the density and the flux anyway as shown in the following:
compiletime load "module_ppp.so";
PPP obj = {};

obj.read("number_Ar_60.00ms.pos", "N");
obj.read("cell_volumes.pos", "vol");
obj.read("velocity_Ar_60.00ms.pos", "v");
obj.xy_plane(0, 20, "nearest_neighbour");
obj.write_pos_scalar("cutplane_xy.pos", "X-flux", vol>0 ? N/vol*v_x ! 0);
Important: Please note, that the velocity is a vector plot. In the
read command we have assigned the variable name v to the velocity.
In the expression below, the three components v_x, v_y and v_z
must be used instead. The appendixes _x, _y and _z are attached
automatically to each variable name in case of a vector plot!.
Depending on the statistics, the cut-plane of the flux plot may look a
bit noisy. In this case, it helps to use the "interpolate" option
rather than "nearest_neighbour":
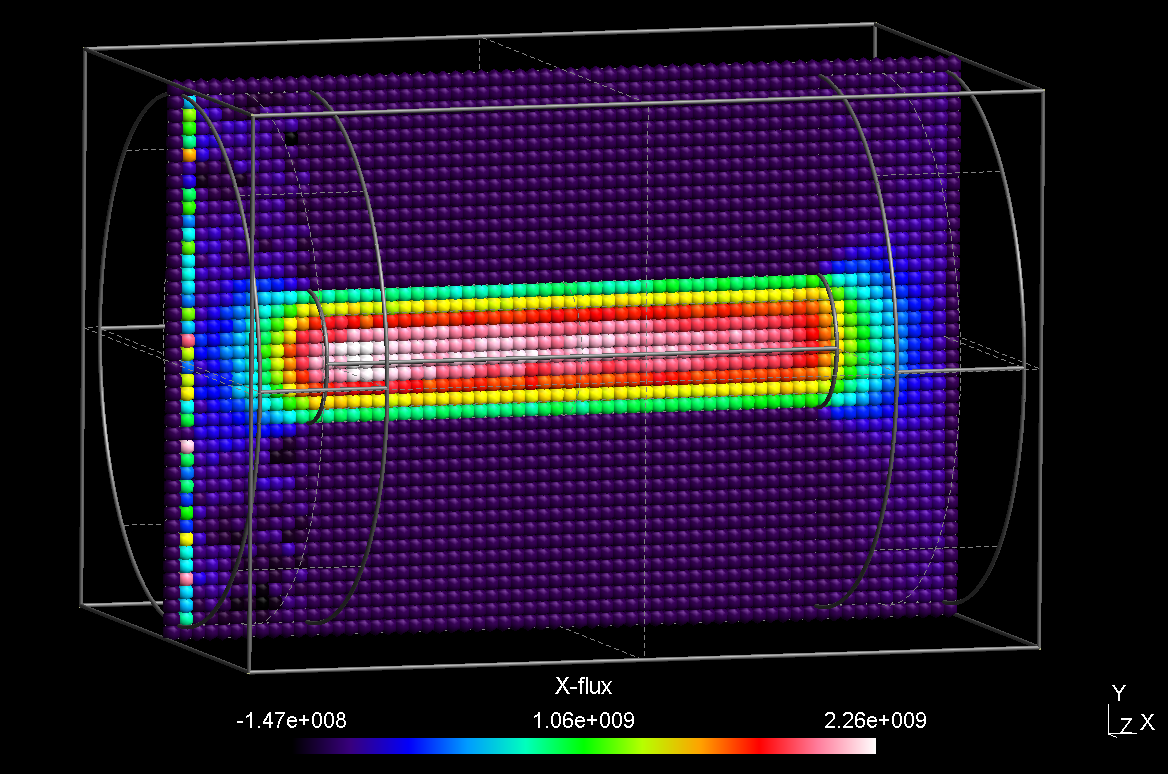
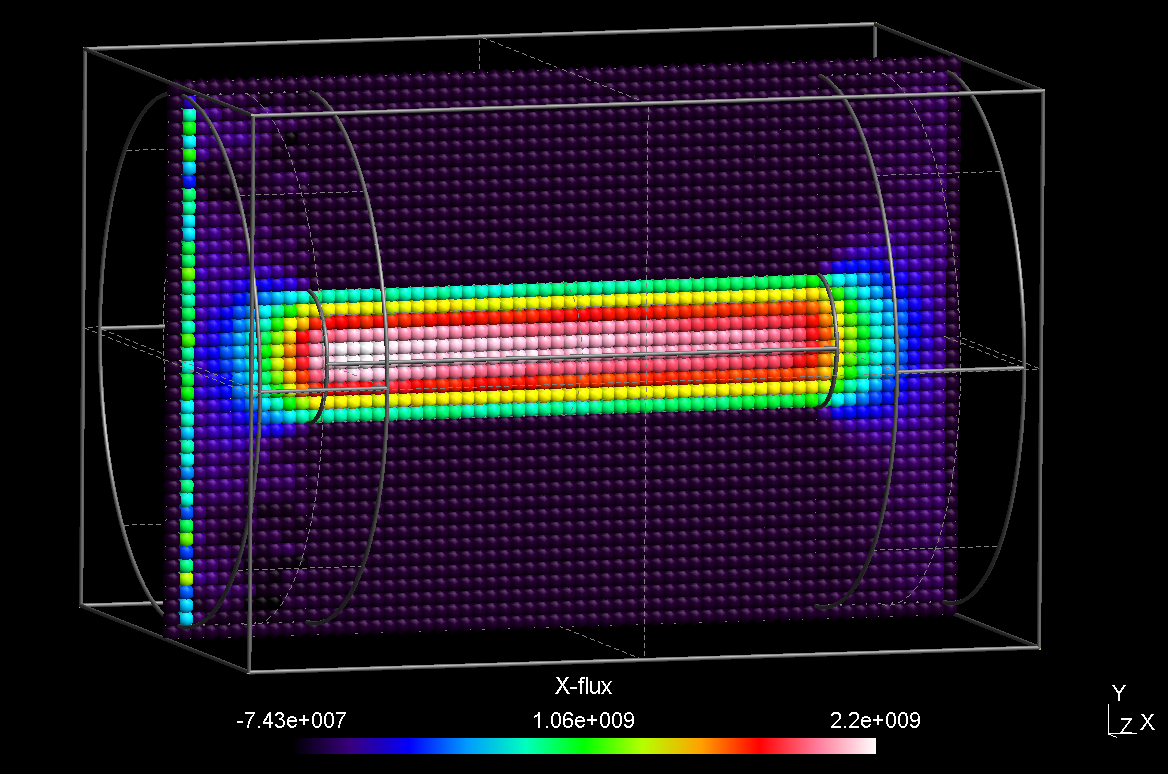
The expression vol>0 ? N/vol*v_x ! 0 contains an implicit if
statement: The computation density = number/volume is not possible for
all cells, since in some cases the volume may be zero. Thus, first it is
checked, if vol>0. If that condition evaluates to true, the
expression behind the ? applies, otherwise the expression branches
behind the ! symbol.
It may look a bit ugly to have these arithmetics in one line. Another possibility is to define the density within the PPP object:
compiletime load "module_ppp.so";

PPP obj = {
  float NREAL=1e11;
  float density: vol>0 ? NREAL*N/vol ! 0;
};

obj.read("number_Ar_60.00ms.pos", "N");
obj.read("cell_volumes.pos", "vol");
obj.read("velocity_Ar_60.00ms.pos", "v");
obj.xy_plane(0, 20, "interpolate");
obj.write_pos_scalar("cutplane_xy.pos", "X-flux", density*v_x);
Since the variables N and vol are not known during definition of
density within the PPP object, it is important to use the alias
method (i. e. the ":") instead of the assign method (i. e. "=")
for definining density. The result of this modified script is the same
as for the script above but now, it looks more clearly arranged.
Time averaging
If you would like to perform averaging of the same quantity over several
time steps, it is sufficient to call obj.read(...) several times but
with the same variable name. An example is given in the
following:
compiletime load "module_ppp.so";

case = "sample2";

PPP obj={};

for (time=100; time<=200; time=time+20) {
  obj.read("$case/density_Ar_$(time).00ms.pos", "d");
  obj.read("$case/velocity_Ar_$(time).00ms.pos", "v");
}

obj.xy_plane(0, 10, "nearest_neighbour");
obj.write_pos_vector_binary("flux-cutplane.pos", "Ar flux [1e18/(m²s)]", 1e-18*d*v_x, 1e-18*d*v_y, 1e-18*d*v_z);
The read command of the PPP object automatically recognizes if one
variable is used several times and performs an averaging of the data in
this case.
Development over time
If you would like to illustrate the development of the same quantity
over several time steps, you need to call obj.append(...) several
times but with the same variable name and then one of the
write_pos_time_steps functions. An example is given in the following:
compiletime load "module_ppp.so";
compiletime load "module_system_linux.so";

# defining parameters
case   = "sample2";
start  = 100;
end    = 200;
dtime  = 20;
unit   = "us";
z      = 0;
folder = "density";
files  = "density_e";

# create ppp subfolder if it does not exist
System FS = { rootpath = "$case"; };
if (FS.folder_exists("ppp") == 0) then {
  out "Creating folder $case/ppp\n";
  FS.create_folder("ppp", 493)
};

# applying a cut plane to each time step
for (time=$start; time<=$end+0.001; time=time+dtime) {
  PPP obj1 = {};

  obj1.read("$case/$folder/$(files)_$(time% 4,2f)$(unit).pos", "X");
  obj1.xy_plane($z, 10, "nearest_neighbour");
  obj1.write_pos_scalar_binary("$case/ppp/cut_$(files)_$(time% 4,2f)$(unit).pos", "$files", X);
}

# appending the cut planes to each other
PPP obj2 = {};
for (time=$start; time<=$end+0.001; time=time+dtime) {
  obj2.append("$case/ppp/cut_$(files)_$(time% 4,2f)$(unit).pos", "Y");
}
obj2.write_pos_time_steps_scalar_binary("$case/timestep_cut_$(z)mm_$(files)_$(start)-$(end)$(unit).pos", "$files", "Y");
First of all module_system_linux.so is loaded, which is needed for
creating the ppp subfolder for storing the intermediate cut planes. Next
some parameters are set including the time interval, the z position of
the cut plane and the name of the plot. Then the ppp subfolder is
created, where the cut planes generated in the next part are stored. In
the last part these cut planes are appeded to each other and written to
the output file.
The order of first creating the cut planes and then appending them to
each other is important, because it is (at the moment) not possible to
make cut planes of variables with multiple time steps. Additionally the
write_pos_time_steps functions can only be called on the variable name
and not on an expression, so that calculations have to be done before.
Generating vector plots as cut plane
Finally we would like to plot the flux as vector plot. All we have to do
is to replace the obj.write_pos_scalar(...) by
obj.write_pos_vector(...). Since a vector plot has three components,
we have three instead of one expression arguments:
compiletime load "module_ppp.so";

PPP obj = {
  float NREAL=1e11;
  float density: vol>0 ? NREAL*N/vol ! 0;
};

obj.read("number_Ar_60.00ms.pos", "N");
obj.read("cell_volumes.pos", "vol");
obj.read("velocity_Ar_60.00ms.pos", "v");
obj.xy_plane(0, 20, "interpolate");
obj.write_pos_vector("cutplane_xy.pos", "X-flux", density*v_x, density*v_y, density*v_z);
Revert POS file data to original state
In case you have applied cut planes to your plots and you want to revert
them to their original state, you can use the identity function.
This is shown in the following example, where the complete density
distribution is created after a cut plane of the number plot was
written:
compiletime load "module_ppp.so";

PPP obj = {};

obj.read("number_Ar_60.00ms.pos", "N");
obj.xy_plane(0, 10, "nearest_neighbour");
obj.write_pos_scalar("cutplane_xy.pos", "Ar number [#]", N);
obj.identity();
obj.read("cell_volumes.pos", "vol");
obj.write_pos_scalar("density_Ar.pos", "Ar density [#/m³]", vol>0 ? N/vol ! 0);
General (oblique) interpolation views
It is possible to generate cut planes in a more general way. For this purpose, a general description of a parametric plane looks as follows:
.
The accordant post processing command is written as:
obj.plane(x0, y0, z0, x1, y1, z1, x2, y2, z2, delta, N, M, "method");
First, the three points of the above equation are given coordinate-wise
(i.e. the first 9 parameters). The next parameter delta is the
vertical distance to the plane, wherin points are considered for
interpolation. The integer numbers N, M give the resolution of the cut
plane in direction of the first and second vector. Update: It is
possible to specify 0, 0 for N, M; in this case the actual
resolution of the imported POS file will be taken.
An example of an oblique plane with respect to our tube DSMC case is shown in the following:
compiletime load "module_ppp.so";

PPP obj={
  float density: vol>0 ? N/vol ! 0;
};

obj.read("number_Ar_60.00ms.pos", "N");
obj.read("cell_volumes.pos", "vol");
obj.read("velocity_Ar_60.00ms.pos", "v");

obj.plane(-110, -210, -210,   200, 210, 0,    200, -210, 0,    15,   40, 40, "interpolate");

obj.write_pos_scalar("obliqueplane.pos", "Density [1/m²s]", density);
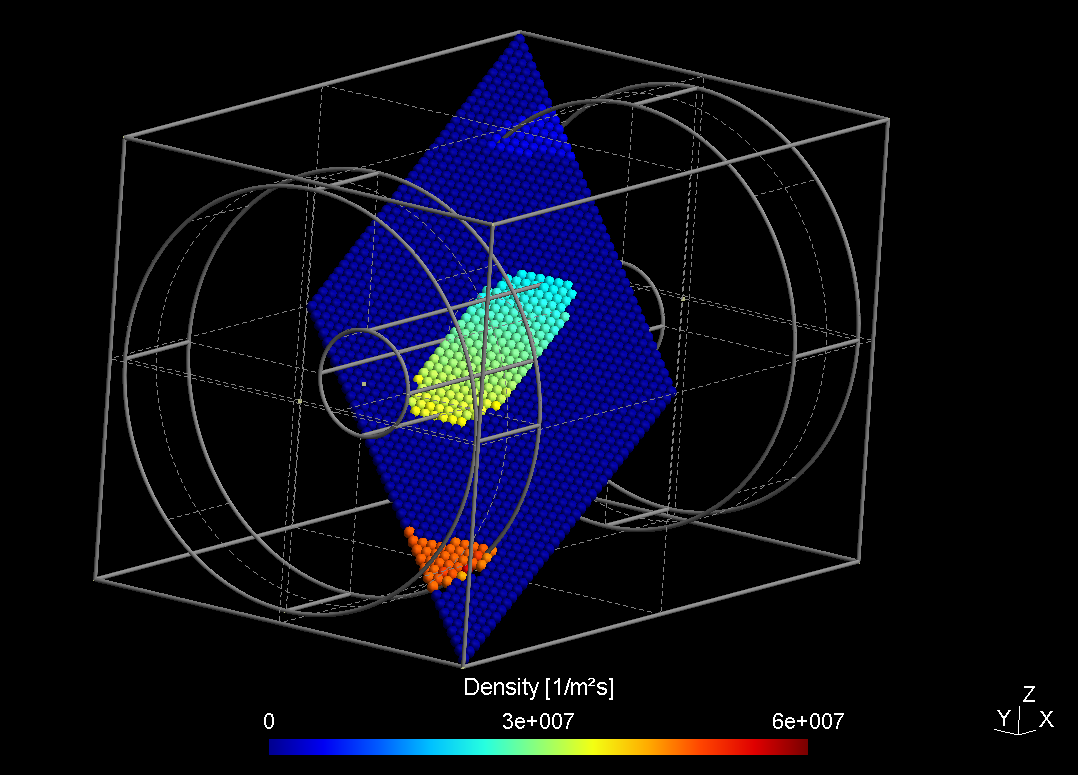
Analogously, it is possible to extract data along a straight line:
with the postprocessing command:
obj.line(x0, y0, z0, x1, y1, z1, delta, N, "method");
Additional output formats
Visualization Toolkit (VTK)
Besides the POS output format of GMSH, it is possible to write the 3D data in the Visualization Toolkit format. The two functions for scalar and vector data are:
obj.write_vtk_scalar("output.vtp", "View title", expression);
obj.write_vtk_vector("output.vtp", "View title", expression_x, expression_y, expression_z);
The syntax is identical to that of the POS format.
Tecplot
Also the Tecplot format is supported for both scalar and vector data:
obj.write_tec_scalar("output.dat", "View title", expression);
obj.write_tec_vector("output.dat", "View title", expression_x, expression_y, expression_z);
Again the syntax is identical to that of the POS format.
ASCII export
TXT output
It is convenient to directly export certain results as ASCII TXT file, which can be imported e.g. in Origin or other graph presentation software. For that purpose, the following method is implemented:
obj.write_txt("file_name.txt", ["col1", "col2", ...], [exp1, exp2, ...]);
The arguments have the following meaning:
- The first argument is the name of the TXT file, which should be created
- The second argument is a list containing all column title strings. They will appear in the first line of the ASCII file.
- The third argument is a list of expressions, which should be
computed for each column.
- Within the expressions, all variable names originating from imported POS files as well as the variables "x, y, z" for the respective coordinates can be used.
- Additionally, the maximum and minimum values of all variables
are computed and can be accessed via
variablename_max,variablename_min.
We demonstrate this in a short example:
compiletime load "module_ppp.so";

PPP obj1 = {};

obj1.read("absorption.pos", "A");
obj1.xy_plane(-141.75, 10, "nearest_neighbour");
obj1.write_pos_scalar_binary("absorption-2D.pos", "SiH4 absorption [1/m²s]", A);

PPP obj2 = {};

obj2.read("absorption-2D.pos", "A");
obj2.line(420, -380, -141.75,   607.5, -380, -141.75,  40, 19, "average");
obj2.write_txt("profile_avg.txt", ["r [mm]", "abs [1/m²s]", "abs [%]"], [x-420, A, 100*A/A_max]);
This script reads a 3D posfile "absorption.pos" of an absorption plot into obj1, creates a 2D cutplane of it and stores the cutplane into "absorption-2D.pos". This created file is then read into a second PPP object obj2. Here, the absorption profile is averaged along a line in X direction. The averaged profile is finally dumped into an ASCII file. The ASCII file finally looks like follows:
         r [mm]   abs [1/m^2s]        abs [%]

        4.93421    3.80416e+20        99.9454
        14.8026    3.77636e+20        99.2152
        24.6711    3.80623e+20            100
        34.5395     3.7374e+20        98.1916
        44.4079    3.75455e+20         98.642
        54.2763    3.73143e+20        98.0347
        64.1447    3.68571e+20        96.8336
        74.0132    3.63662e+20        95.5439
        83.8816    3.58961e+20        94.3087
          93.75    3.54935e+20         93.251
        103.618    3.47403e+20         91.272
        113.487    3.43792e+20        90.3235
        123.355    3.31429e+20        87.0752
        133.224    3.24909e+20        85.3624
        143.092    3.18416e+20        83.6563
        152.961    3.03792e+20        79.8144
        162.829    2.88857e+20        75.8905
        172.697    2.66338e+20        69.9741
        182.566    2.29174e+20        60.2102
CSV output
Instead of TXT files, writing the output in the CSV format is also
possible. The syntax of write_csv is identical to that of write_txt:
obj.write_csv("file_name.csv", ["col1", "col2", ...], [exp1, exp2, ...]);
The column separator is a colon, which is explicitely mentioned in the file and the decimal separator is a point.
Numerical integration
The numerical integration feature is currently available for cut-planes only. In our tube example we might want to integrate the particle flux through the tube. This can be accomplished as follows:

compiletime load "module_ppp.so";

mesh_unit=1e-3;
Nsccm = 4.478e17;

file "integration.txt" <<
for (time=20; time<=400; time=time+20) {
  PPP obj={};

  obj.read("density_Ar_$(time).00ms.pos", "density");
  obj.read("velocity_Ar_$(time).00ms.pos", "v");
  obj.plane(200, -60, -60,   200, 60, -60,   200, -60, 60,  10, 0, 0, "interpolate");

  flow = obj.integrate(density*v_x)*mesh_unit^2/Nsccm;
  out "$(time)  $(flow)\n";
}
Script for obtaining integrated flow through cross section
In the script shown above, the density and velocity of Argon are loaded
for a complete time series t=20...400 ms. For each time step, a PPP
object is created, and the flux is generated via the expression
density*v_x within the cut plane. With the integrate function, the
total flux through the tube cross section can be computed.
The numerical integration is internally performed over triangles of
adjacent points. For each triangle, the average of the three point
values is multiplied with the area of the triangle element. If the mesh
unit is not 1 m, the integration result should be multiplied with
mesh_unit^2 in order to get the correct unit.
In the example script, the result is additionally divided by the particle number per second for 1 sccm in order to get the flow in sccm.
Merging of (position) plots
In the normal output files (e.g. density) each point corresponds to a single cell with its position and its value. A second density plot has the same cells at the same position but with different values. Therefore it makes no sense to merge these files into a single one, this is only the case for position plots, where the positions of particles are stored independent of the cell resolution. By merging multiple of these files the illustration of the particle movement is possible:
compiletime load "module_ppp.so";

PPP obj = {};

for (float time=0; time<=100; time=time+0.5) {
  obj.merge("position/position_e_$(time %,2f)ns.pos", "pos");
 }
obj.write_pos_scalar_binary("position_e_0-100ns.pos", "e position", pos);
In this example a position plot each 0.5 ns for a time interval between 0 and 100 ns is merged and written to a single file. The syntax of the merge function is identical to that of the read function.
Manipulation of data
General concept
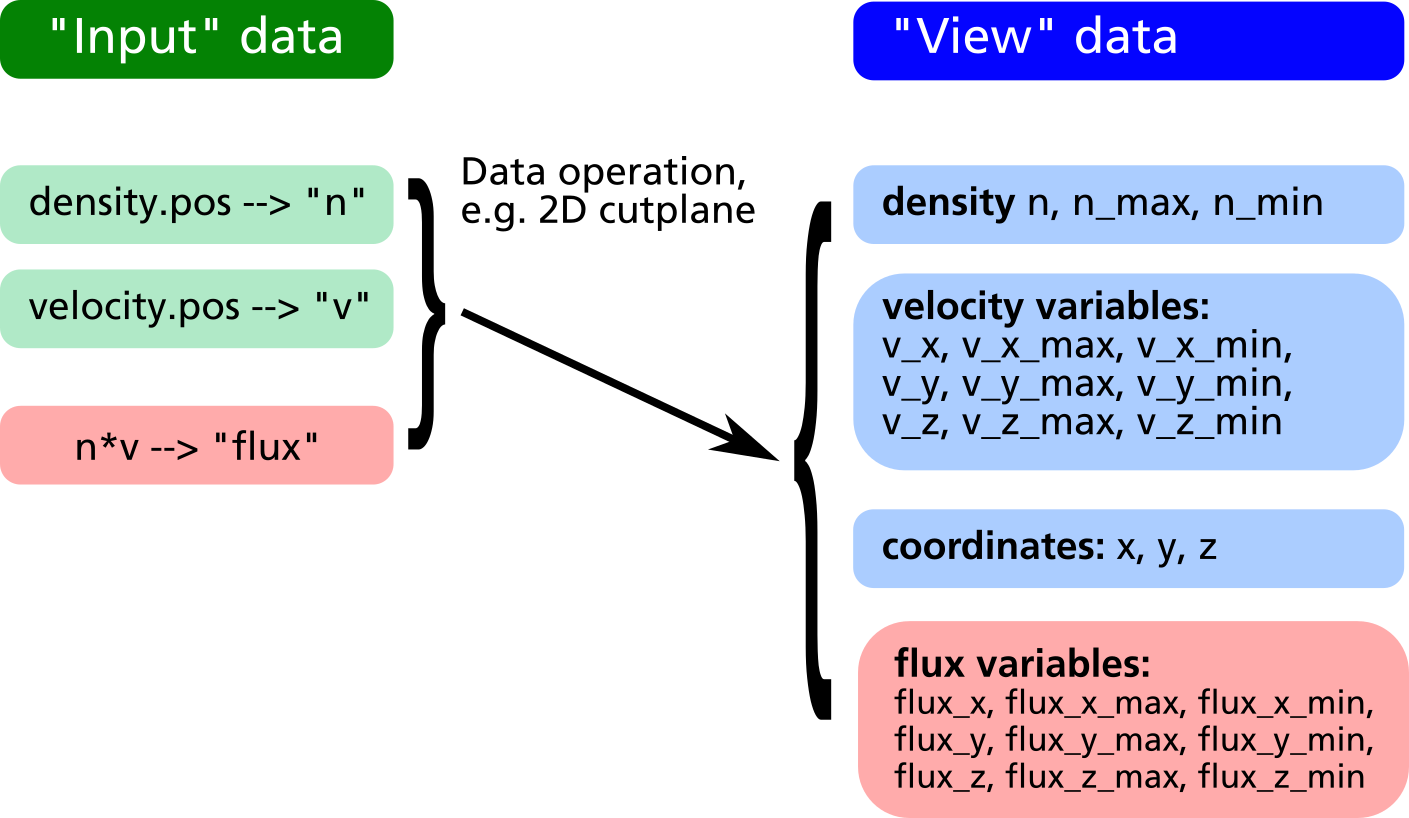
The RVM postprocessing module generally uses two different data sets, namely the "input" and the "view" data as shown in the figure below.
- The "input" data consists of the raw data obtained from the
simulation output files (GMSH POS format). With every
readcommand, a new entry in the input data is created. Each input data can be assigned a short name which will be later used as variable name (e.g. "n" for density in the figure below). - The "view" data are obtained from the "input" data by some
geometric transformation, e.g. a 2D cut plane or a line scan. They
have the same names as the input data with some exceptions:
- If the input data are vectors (e.g. the velocity field "v" in
the example below) three different "view" variables
v_x, v_y, v_zare generated in order to allow a component-wise access to the vector field. - Additional variables such as the coordinates
x, y, zas well as maximum and minimum values for each "view" variable (n_min, n_max, v_x_min, v_x_max etc.) are automatically generated and appended to the "view" dataset.
- If the input data are vectors (e.g. the velocity field "v" in
the example below) three different "view" variables
- If another geometrical operation is applied, the former "view" data is being deleted and replaced by data generated from the "input" in connection with the geometrical operation.
- If no geometrical operation is applied at all, the "view" data
will be a copy of all input data (in former versions, the command
obj.identity();had to be explicitely invoked for that purpose, nowadays this is automatically done internally).
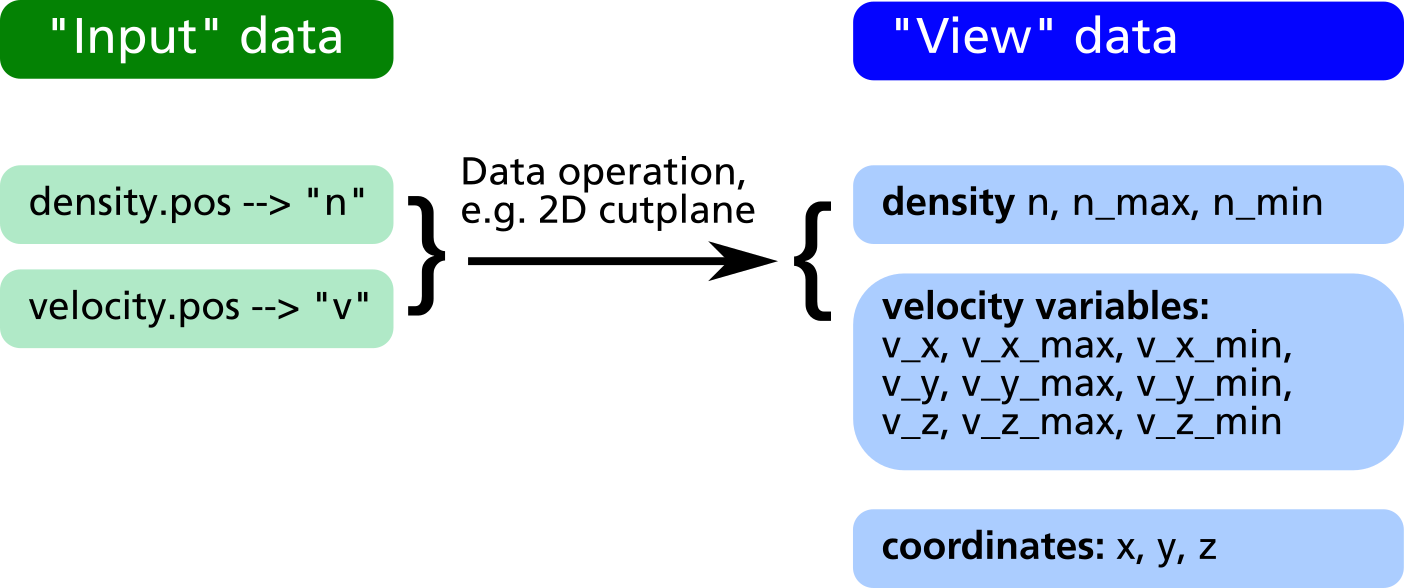
After applying the geometrical operations, in the obj.write_XXX
commands all variable names in the "view" data can be used for forming
mathematical expressions defining what to extract into the output files.
For the above example it is e.g. possible to extract the particle
flux, i.e. the product of density and velocity, in direction of the Z
coordinate as well as the relative density distribution in %:
compiletime load "module_ppp.so";
PPP obj = {};

obj.read("density.pos",  "n");
obj.read("velocity.pos", "v");
obj.xy_plane(0, 10, "nearest_neighbour");

obj.write_pos_scalar_binary("flux-Z-2D.pos", "Vertical flux [1/m^2 s]", n*v_z);
obj.write_pos_scalar_binary("density-relative.pos", "Relative density [1/m^2 s]",
                            100*n/n_max);
Creation of new input data
Usually, the input data is obtained directly via the command
obj.read("filename", "label");. In some cases it may be useful to
create additional input data via an algebraic formula from the existing
data. For this purpose, the following commands can be used:
obj.create_scalar("new_label", expression);--> Create new scalar input data entryobj.create_vector("new_label", exp_x, exp_y, exp_z);--> Create new vector input data entry
In the example above, it is possible to plot the relative density
distribution in % because of the existence of the view variable n_max.
However it is not clear how to plot e.g. the relative flux distribution,
since there is no obvious way to obtain the maximum value of n*v_z. By
creation of a "flux" variable as new input entry, this problem can be
solved (see example listing and data structure diagram below).
compiletime load "module_ppp.so";
PPP obj = {};

obj.read("density.pos",  "n");
obj.read("velocity.pos", "v");

obj.create_vector("flux", n*v_x, n*v_y, n*v_z);

obj.xy_plane(0, 10, "nearest_neighbour");

obj.write_pos_scalar_binary("flux-Z.pos", "Vertical flux [1/m^2 s]", flux_z);
obj.write_pos_scalar_binary("flux-Z-relative.pos", "Relative Vertical flux [%]",
                            100*flux_z/flux_z_max);
Reduction of input data
Let us assume we have 3D data of the density and velocity of evaporated atoms. In the XY-plane at Z=100 there is a substrate where the evaporated atoms can condensate.
First, in order to get the thickness profile on the substrate, the flux has to be extracted by multiplying density and z component of velocity in a cut-plane just below the substrate surface.
Second, let us assume the substrate is moving into Y direction, i.e. we have a dynamic deposition. In such cases, only the linescan of the profile in X direction averaged over Y is of relevance.
In order to do this, in prior versions of the post processing module it was required to make the 2D cut plane first, save it into a temporary POS file, load this POS file into a second post processing object and finally extract the line profile from there.
From version 2.4.3 on, there is the possibility of reducing the input data according to the last executed geometric operation, the command syntax is:
obj.reduce();--> Reduction of input data space according to current arrangement of view data.
This allows for obtaining a line profile from 3D data in a much easier way:
compiletime load "module_ppp.so";
PPP obj = {};

aperture_width = 100;   # Aperture width on substrate in transport direction

obj.read("density.pos", "n");
obj.read("velocity.pos", "v");

# Define vertical flux component
obj.create_scalar("Fz", n*v_z);

# Make cut plane of data just below the substrate surface
obj.xy_plane(99.5, 10, "nearest_neighbour");

# Reduce input data to cut-plane (this is the important command)
obj.reduce();

# Make another cut plane averaging over the aperture_width
# in order to get the line profile
obj.xz_plane(0, aperture_width/2, "average");

# Write line profile into TXT file
obj.write_txt("absorption_line.txt",
              ["x", "avg_absorption", "rel_absorption"],
              [x, Fz, 100*Fz/Fz_max]);
Control of written data
Regarding the format of written data, there are the following possibilities:
- The coordinates, where the written data get plotted in POS files, can be explicitely specified
- It is possible to set a flag deciding whether to write data at a given coordinate point or not
The first option involves the following output methods:
obj.write_pos_scalar_parametric("filename.pos", "Legend", x, y, z, expression);obj.write_pos_scalar_binary_parametric("filename.pos", "Legend", x, y, z, expression);obj.write_pos_vector_parametric("filename.pos", "Legend", x, y, z, exp_x, exp_y, exp_z);obj.write_pos_vector_binary_parametric("filename.pos", "Legend", x, y, z, exp_x, exp_y, exp_z);
The first two commands are for parametrized scalar plots (in ASCII and binary format, respectively), the second two commands are for vector plots. An example is given in the following listing.
compiletime load "module_ppp.so";

PPP obj = {};
obj.read("density.pos",  "n");
obj.read("velocity.pos", "v");
obj.xy_plane(100, 10, "nearest_neighbour");

# Plot density and flux side by side. A coordinate offset allows for
# loading both pos files into GMSH and have the cut planes non-overlapping

obj.write_pos_scalar_binary_parametric("density-2D.pos", "Density [1/m^3]", x, y, z, n);
obj.write_pos_scalar_binary_parametric("flux-2D.pos", "Flux [1/m^3]", x+200, y, z, n*v_z);
In order to control explicitely, which data point should be written and
which should be omitted, there is the possibility to define a
write_flag variable within the postprocessing object. This is
demonstrated in the following:
compiletime load "module_ppp.so";

PPP obj = {
  write_flag: A>0;
};

obj.read("absorption.pos", "A");
obj.write_pos_scalar_binary("absorption-noZeros.pos", "Absorption [1/m^2 s]", A);
In a large 3D absorption file, non-zero values only occur at the
intersection between volume grid and mesh elements of walls. Thus a
large fraction of the POS file consists of zeros, which is a waste in
memory consumption. With the above script, the write_flag variable
forces the write routine to only output those values with non-zero
absorption, i.e. A>0.
It is important to define write_flag with a colon and not to write
write_flag = (A>0);. In the rvm scripting language, the colon means
that the value of write_flag will be only computed on request
according to the currently defined parameters on right side. With the
regular "=" assignment operator, the value of the variable A will be
required at the moment of the definition of write_flag, which is not
the case in the above script.
It is also possible to combine multiple conditions e.g. in order to specify a certain coordinate range for output:
compiletime load "module_ppp.so";

PPP obj = {
  write_flag: (abs(x)<100) and (y>-50) and (y<150);
};

# ...
Convolution function
A convolution function has been implemented to operate on target absorptions plots in an attempt to model erosion profiles in MoveMag aplications. The primary approach here is to assume plasma and ion bombardment, respectively do not change with magnetron position which should be valid for small displacements vectors. Thus, we simply integrate over time the convolution of a time deviant, i.e. moving absorption plot with a stationary step function.
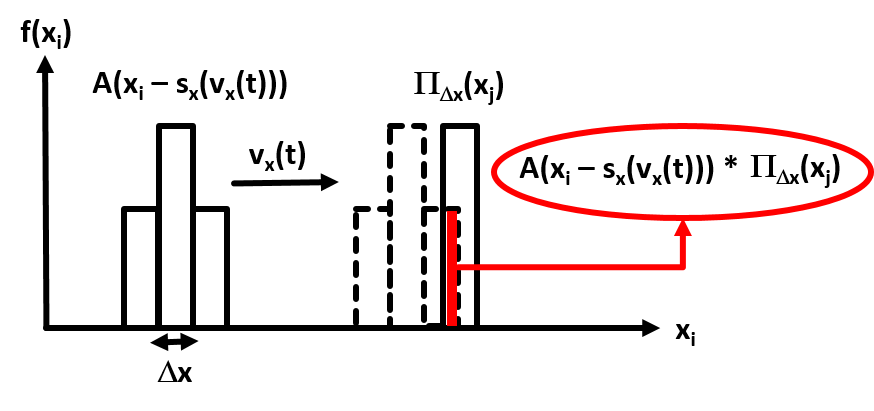
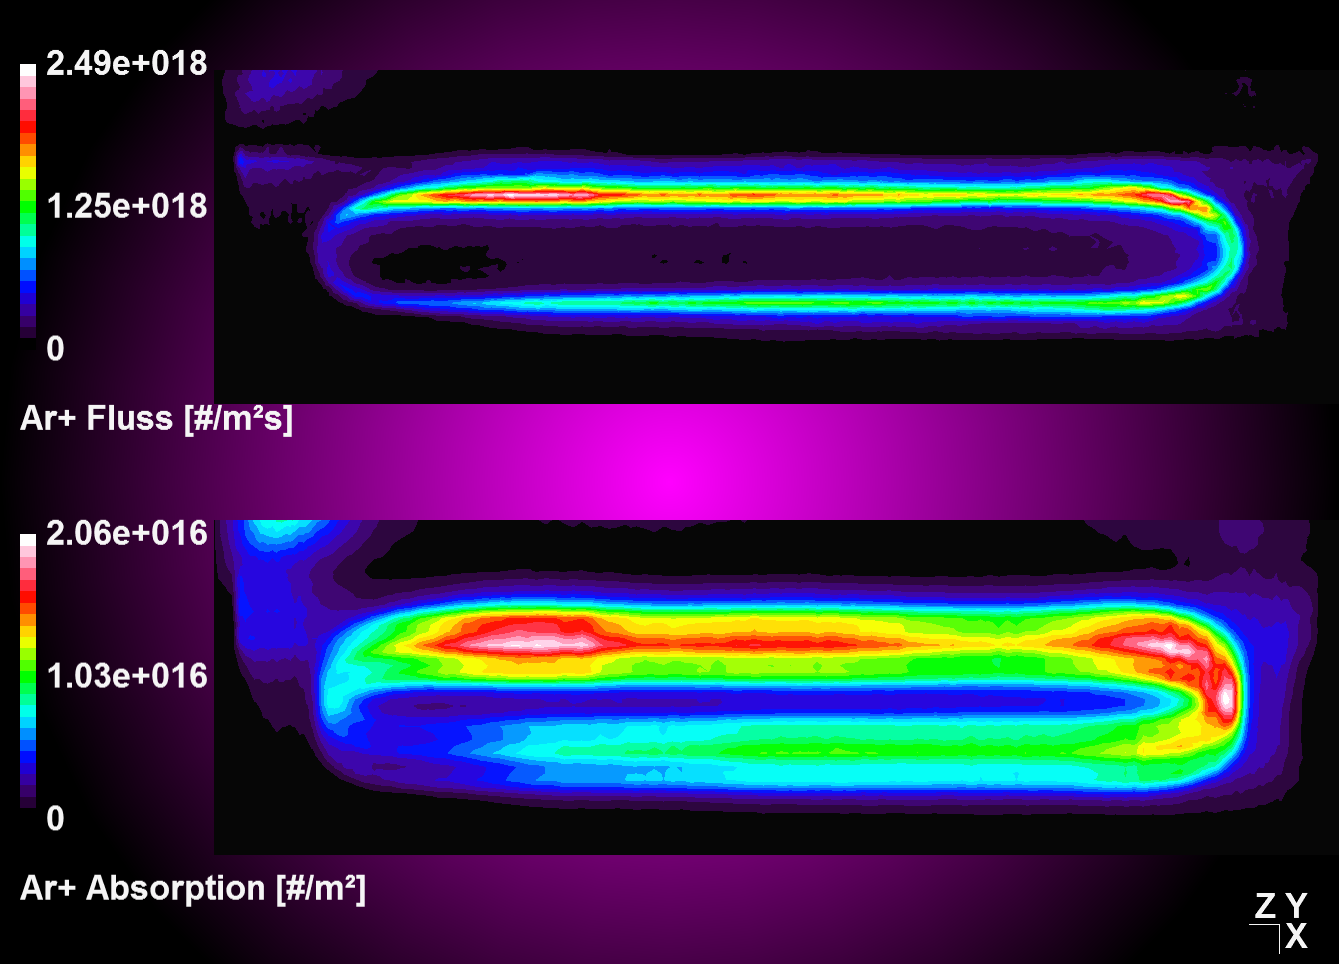
| Convolution and integration over time of moving source data with stationary step function. | Absorption plot (top) and convolution result (bottom) for a periodic oscillation in y. |
|---|
compiletime load "module_ppp.so";

PPP obj1 = {};

#Define velocity vector and integration time
float vx[4], vy[4], vz[4]; #[m/s]
float T = 4; #[s]

#Oscillation starting from center position
#Move 1s to left with 1 m/s, then 2 times to right accordantly, then left again.
vx[0] = -1;
vx[1] = +1;
vx[2] = +1;
vx[3] = -1;

obj1.read("absorption_Arplus_100.00us.pos", "val");

obj1.xz_plane(0.0088, 1, "nearest_neighbour");

obj1.reduce; #Operate on cut plane (2D) data set for better performance!

obj1.convolution(vx, vy, vz, T, 0);

obj1.write_pos_scalar_binary("absorption_Arplus_100.00us_xz-plane_convolution.pos", val);
Convolution with linear weighting
Entering '1' for the weighting flag enables a linear weighting scheme during convolution operation from 1 (no displacement) to 0 (maximum displacment). With this you can realize an interpolation between two or more states, i.e. magnetron positions, by merging the results from corresponding convolution operations together.
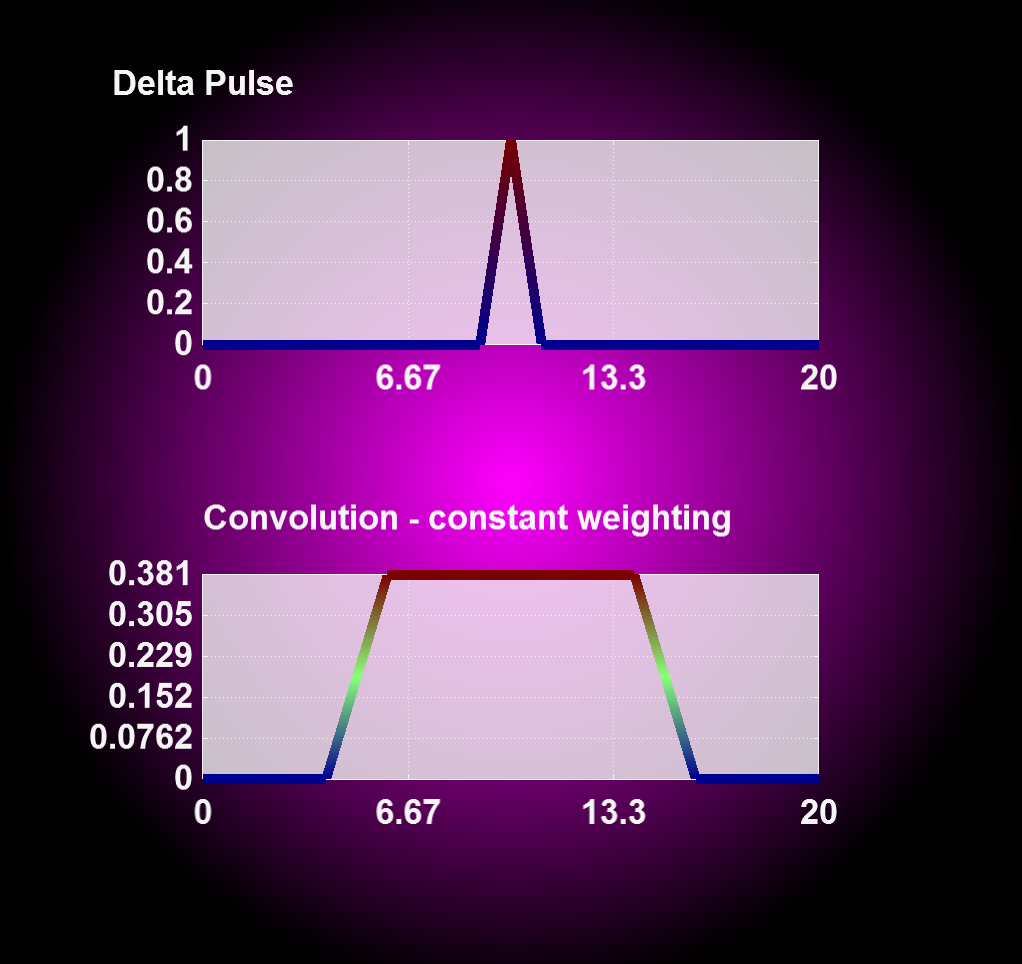
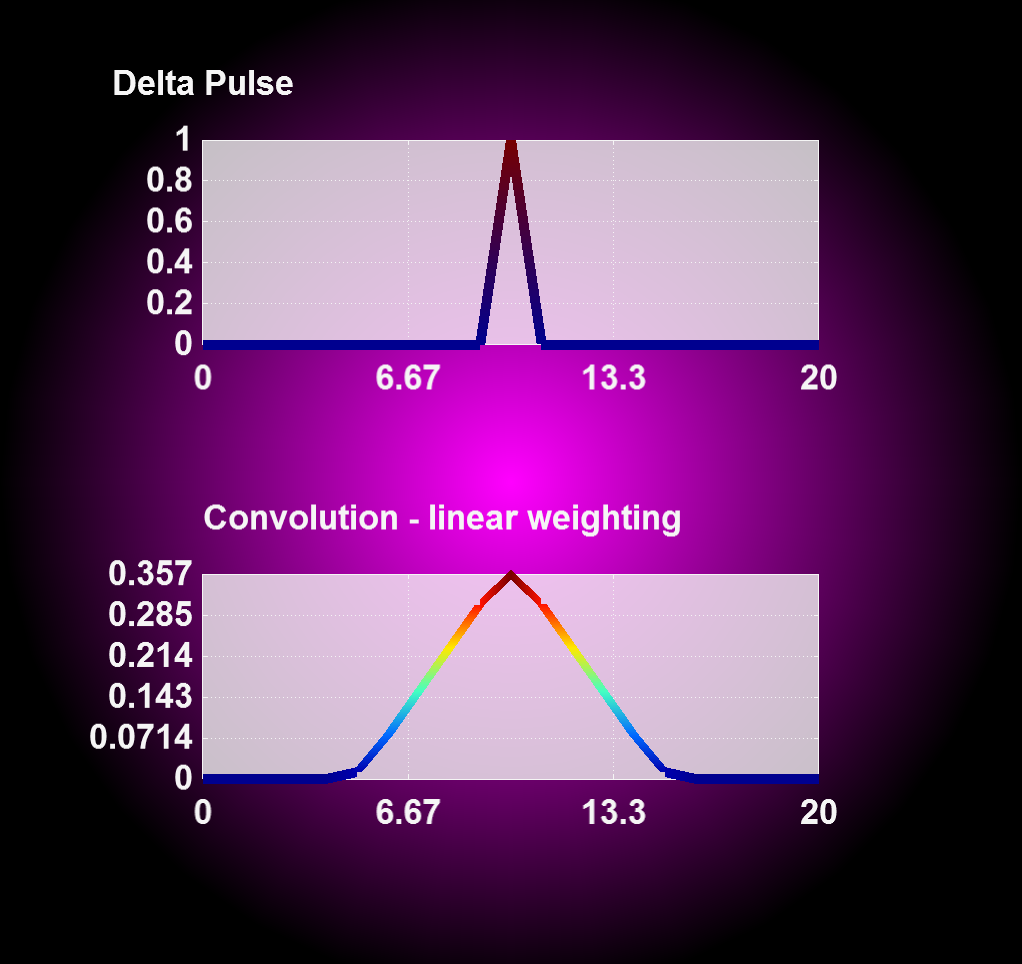
| Convolution with constant weighting. | Convolution with linear weighting. |
|---|
Circular Convolution
For a 360° convolution over the plot center use the function 'convolution_circular()' as seen below. This function has been implemented to adress modeling of absorption profiles on rotating substrates.
compiletime load "module_ppp.so";

PPP obj1 = {};

obj1.read("absorption_Arplus_100.00us.pos", "val");

obj1.xz_plane(0.0088, 1, "nearest_neighbour");

obj1.reduce; #Operate on cut plane (2D) data set for better performance!

obj1.convolution_circular();

obj1.write_pos_scalar_binary("absorption_Arplus_100.00us_xz-plane_convolution.pos", val);
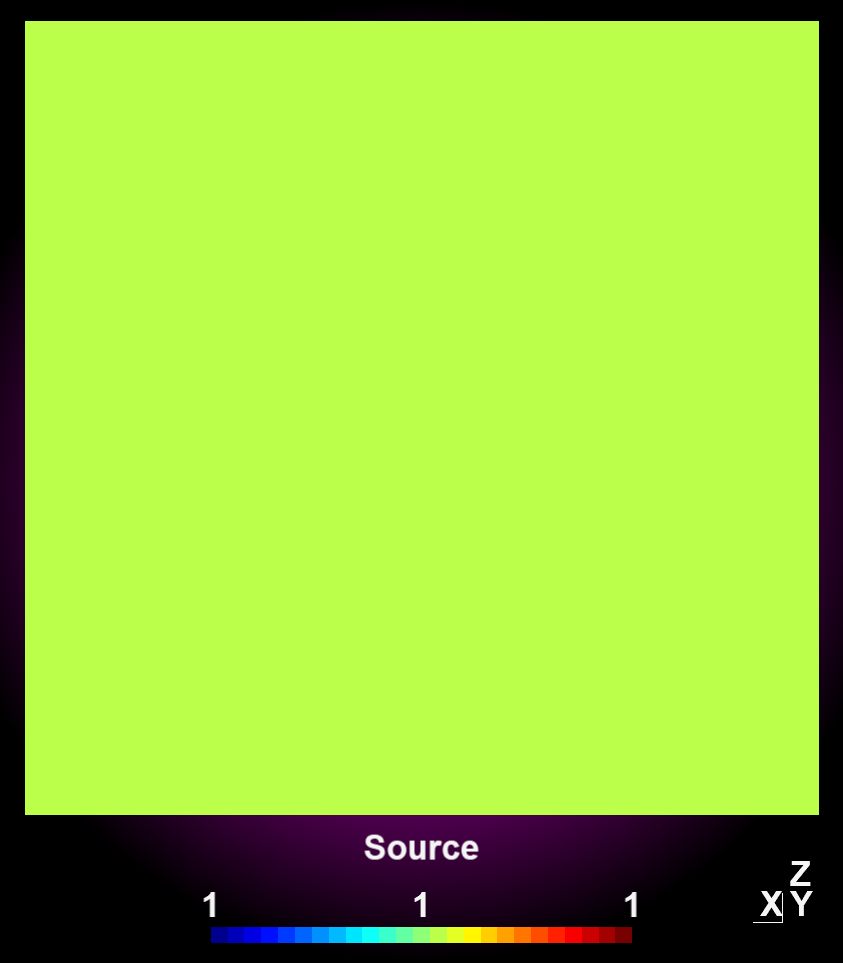
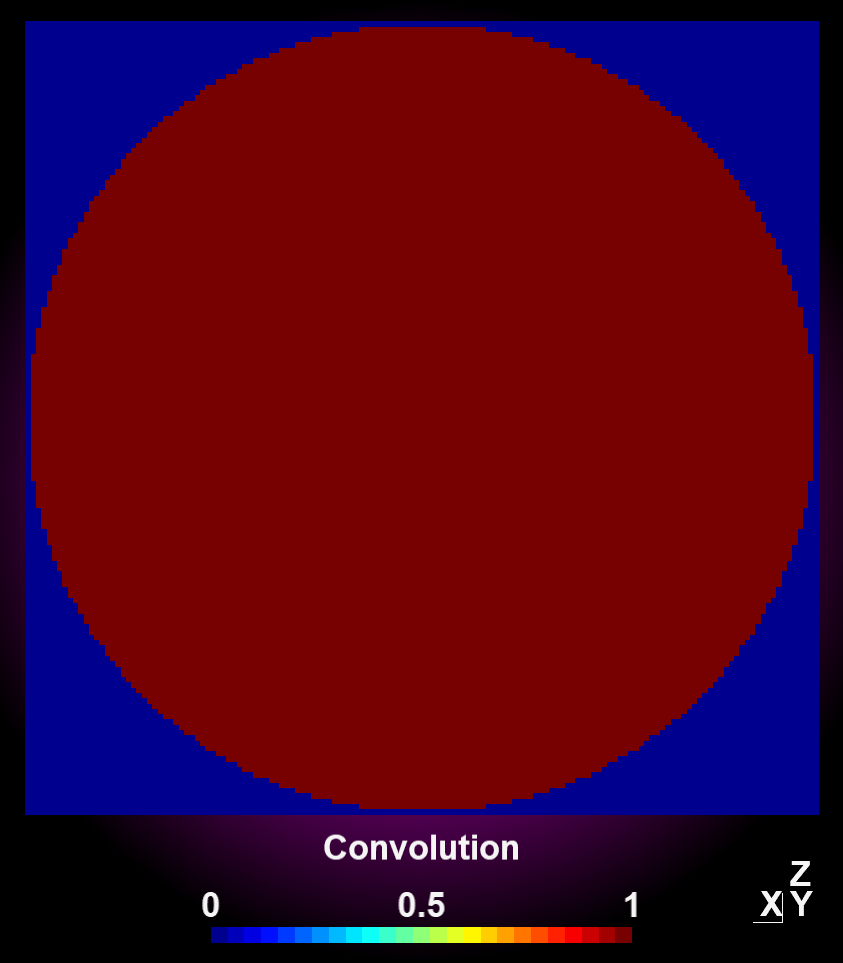
| Source data. | After circular convolution. |
|---|